

Read Time: 4 minutes
You are no doubt hearing the doom and gloom the mainstream media in Australia continue to push. “Property values dropping to an all-time low” is the phrase that is being repeated day after day. However, 30 years of property data indicates that the property market operates in a cyclical fashion.
We begin by looking at the Australian Property Market from 1988 to 1992:
The top performer, Brisbane, saw its property prices nearly double in value.
Even the worst performer, Adelaide, saw an increase of 25.2% in property value.

We continue onward toward the Australian property market trends from 1993 to 1997. Some observations:
Canberra dropped 5.2% (from a + 66.8% during 1988 - 1992)
Darwin was the highest performer with an increase of 56.5%

The Australian property market from 1998 to 2002 is quite similar to the property market in the past few years.
Melbourne and Sydney lead the way with increases of 88.2% and 84.2% in property value respectively.
Darwin, the highest performer of the prior period (+56.5% previously) came out as the lowest performer at +5.1%.

From 2003 to 2007, the Australian property market once again shows increases in property value, but in cities where you least expect.
This time, Perth is our highest riser, with an increase of 139.8% in property value. Hobart is also experiencing an unprecedented boost of 126.4%.
As opposed to last period, our lowest performers are Sydney and Melbourne at +16.4% and 59.9% respectively.

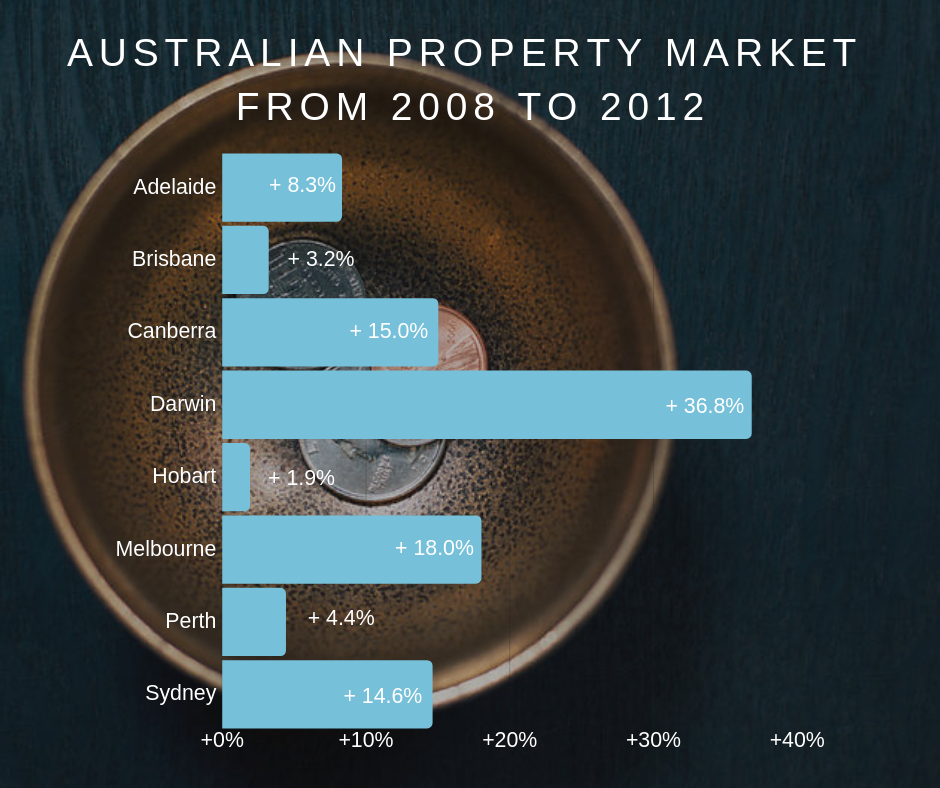
From 2008 to 2012, a slower rise in Australian property market value, however, still a rise nonetheless, despite the impacts of the GFC.
Our highest performer is Darwin at + 36.8%.
Our lowest performer is Hobart at +1.9% (+126.4% previously).
Finally, we conclude with the last time period. The Australian property market value from 2013 - 2017.
Though the market has once again begun to shift, we can see the recent trend of Sydney and Melbourne dominating the property market at +74.6% and 63.7% respectively.
Darwin was our lowest performer. Dropping 10.5% over the course of this time period.

While is it impossible to accurately predict the future of Australian property, we can utilise past data to make informed forecasts. For the most part, all the capital cities of Australia have experienced continual increases in property value from 1988 - 2017.
2017 marked the start of a new cycle for Sydney and Melbourne, with property values declining after a sustained period of growth, these markets are showing lots of opportunities for the educated buyer. The capital cities of Brisbane, Adelaide and Canberra are in rising markets and we forecast will now have a period of sustained growth.
Milk Chocolate is a property service offering Australian expats an expert buying, renovating and management concierge. We first help to identify your objectives for a property investment/home purchase, then manage the entire end-to-end process, including coordinating the location research, due diligence, purchase, liaison with financiers, renovation and tenanting if an investment property. Our unique digital platform allows clients to review data, suburb insights, suggested properties and then monitor the progress of purchases and any renovations. If you’re thinking of renovating or purchasing in Australia and simply unsure how to progress please get in contact to see if we can help.
Sources: CoreLogic
#onthehunt #milkchocproperty #propertyconcierge #borderlessinvesting #data
Make sure you are following us on Facebook, Instagram, Pinterest and LinkedIn for more news, handy insights and inspiration.
If you like this post, we’d love it if you could share :)
Disclaimer: All data and information provided on this site are for informational purposes only. Milk Chocolate makes no representations as to accuracy, completeness, currentness, suitability, or validity of any information on this site and will not be liable for any errors, omissions, or delays in this information or any losses, injuries, or damages arising from its display or use. All information is provided on an as-is basis.
