

The leading indicators including clearance rates, housing affordability, home loan approvals and market sentiment, have pointed to a high chance that the national property market is navigating around the floor.
The recent auction results show the property market continues to hold steam in Sydney and Melbourne, whilst remaining stable in other regional cities in recent months. This is supported by the major drivers: clarity of policies after the election, two consecutive interest rate cuts by the RBA, APRA serviceability adjustments and income tax cuts by the government.
For the first time in 2 years, the Sydney and Melbourne markets have increased in values marginally by 0.07% and 0.24% respectively over the month ending 30th June, 2019.
This is a pivotal moment, since the peak in 2017 to date, the Sydney market lost 14.9%, Melbourne lost 11%, Perth lost 20% and Darwin lost 30%. Overall, the combined capital cities lost 10%.
Together, with small gains, the clearance rates in the two largest cities have been strong, reaching a high of 78% in Sydney and 74% in Melbourne over the recent weeks. Many experts suggest the market will likely trend upward, or at least, will be stabilised in the coming months.
The current median price (as at 30th June 2019) of houses in Sydney is $867,000, in Melbourne is $709,000 and in Canberra, $657,000. While in other capital cities, the prices range from $450,000 to $550,000.
If the market has reached the bottom, how far will it grow again in the next cycle?
In the previous cycle, 2012-2017, properties in Sydney and Melbourne increased by around 70%, which was the largest rise for a cycle in history.
If history repeats itself, the house prices will reach new levels as follows:

However, the likelihood of this happening is relatively low, which is due to the fact that the housing market is bounded by the key long-term national economic fundamentals, and to some extent, global economic factors also.
Employment and Wages
Despite the national unemployment rate long-term trend sitting at 5.2%, the majority of new jobs are part-time. For instance, in the month of May 2019, of 42,200 newly created jobs, only 2,400 were full-time and 39,800 were part-time. This partly reflects the rapid realisation of the gig/sharing economy trend where it will be the norm for workers to engage in multiple jobs at the same time.
Despite the growing labour force, the number of hours worked by all Australian workers declined by 5.9 million hours to 1.775 million hours in the month of May, 2019. This reflects the fact that the economy is not creating enough jobs to absorb the labour supply for the growing number of job seekers.
As a result, wage growth has been minimal in recent years. In the five year period to 2018, the average annualised wage growth was 2.2%, which is significantly lower than in the previous five years to 2013 at 3.3%.
Moving forward, it is likely that wage growth will continue to be minimal in the years to come, which will limit the home loan size that banks are willing to supply.
Household Debt
Household debt is another factor to consider. Compared to the start of the cycle seven years ago, the level of indebtedness of Australian households has reached an all time high of 200% of household income.
This means that households have to spend a large portion of their income for debt servicing, which will likely have negative spill-over effects on other sectors of the economy such as weakening the retail industry and tight spending on education and healthcare. In addition, it becomes harder than before for households to afford larger and better homes, which will also limit price growth.
Overseas Immigrants
On the other hand, a large percentage of demand for property comes from newly arrived immigrants, who need to either buy or rent a place to live, right away. In fact, of 400,000 people added into the country in 2018, 250,000 people or 63% of total growth was immigrants.Previous trends shows that the majority of immigrants will reside in Sydney and Melbourne, which will generate strong demand for properties in these two cities.
This group of buyers are fundamentally different to the local buyers: they are more skilled and educated due to the points-based immigration system, for which they are more likely to reside in big cities. They are also more likely to be financially better off than local buyers due to the tradition of Asia, where families invest and support generously in their off-springs.
In fact, like-for-like properties in Sydney and Melbourne are probably still cheaper than in large Asian cities such as Shanghai, Beijing, Singapore and New Delhi. This coupled with world-class health care and education systems, as well as an unpolluted environment and natural beauty, we will see quality properties with large parcels of land in good locations are always going to be sought after.
Price Forecast for the Next Cycle
We forecast the future price growth based on the long-term price growth of 5-7%/per year, the current market conditions and the fundamental factors that affect the property market. It is predicted that growth of the next cycle will not be as strong as in the previous ones, mainly bounded by the affordability issue and global economic and political uncertainties.
Sydney: we forecast the Sydney market will experience minimal growth in the next five years, in the range of 3-5% per year. This is because Sydney is currently the most expensive property market in Australia and the world, the growing price gap between Sydney and other capital cities and sluggish wage growth in the future.
Melbourne: we forecast the Melbourne market will perform better than Sydney, at 4-6%, because of lower price level (23% lower than Sydney), strong economic fundamentals and high population growth.
Other capital cities: the price growth will be less volatile than in Sydney and Melbourne. These markets will likely follow the long-term trends at 3-5% per year in the next five years.

Capital Growth During Previous Booms: Houses
Overall, properties with large components of land, located in good locations (limited supply) will continue to be sought after. The supply of more affordable housing including units in Sydney and Melbourne is needed to meet the demand of city workers on budget and immigrants. However, the prices of units probably have little room to grow further due to affordability issue of unit buyers.

Median Price (Houses, June 2019)

Median Price Growth (%)
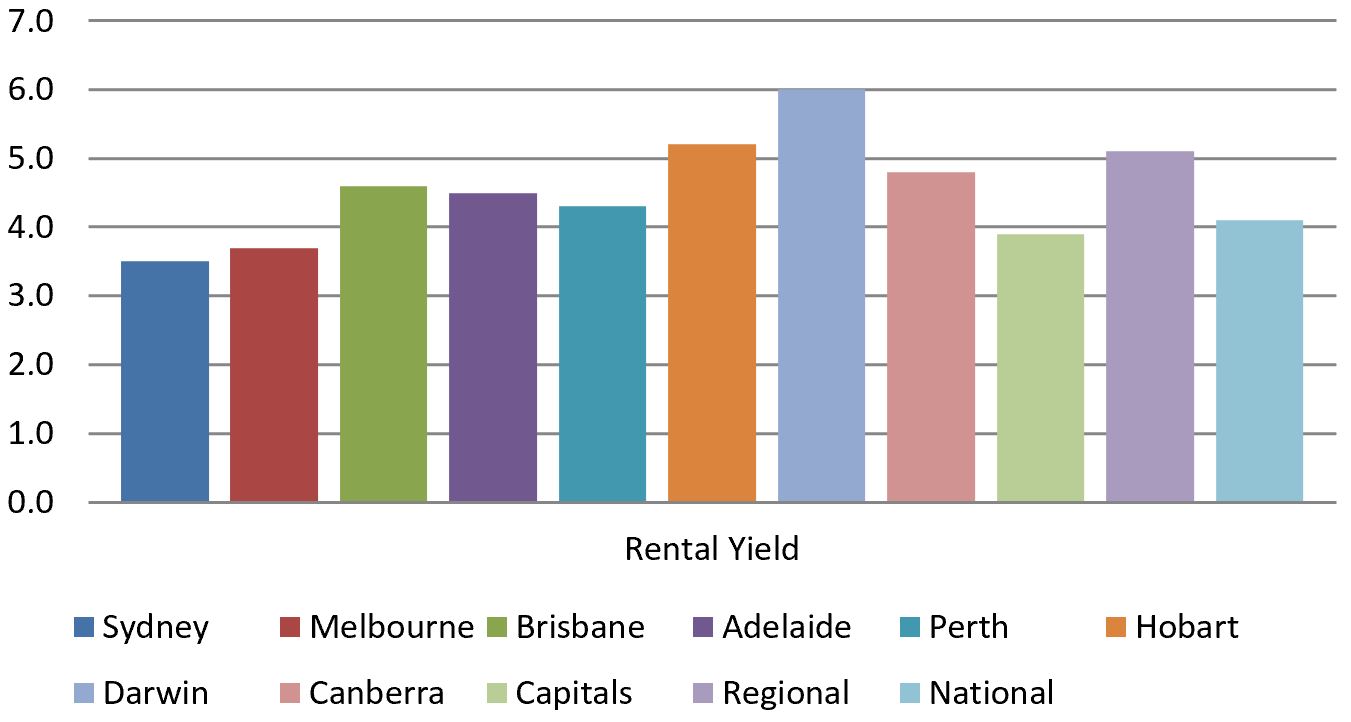
Rental Yield across Australia

Market Forecasting for Houses, if the growth in the last cycles repeats

Auction Clearance Rates (%): Major Capital Cities

Number of Houses sold by Auctions, Capital Cities
Sources: abc.net.au | Parliament of Australia (APH) | Australian Bureau of Statistics |
If you like this post, we’d love it if you could share :)
Disclaimer: All data and information provided on this site is for informational purposes only. Milk Chocolate makes no representations as to accuracy, completeness, currentness, suitability, or validity of any information on this site and will not be liable for any errors, omissions, or delays in this information or any losses, injuries, or damages arising from its display or use. All information is provided on an as-is basis.
