

The Australian property market experiences its fourth consecutive month of decline over the month of August as COVID-19 continues to impact each state, especially Melbourne. However, the overall downward property trend seems to be stablising with only three of eight capital cities experiencing a fall in dwelling values. Expanding on this, the rate of decline for two of the three capital cities that had experienced a fall in dwelling values (those two being Sydney and Brisbane) have eased compared to last month.
So let’s take a dive into how each region performed in August:
Sydney
August: Capital Growth, Houses: - 0.5%
August: Capital Growth, Units: - 0.3%
August: Capital Growth, All Dwellings: - 0.5%
Median Dwelling Price, Houses: $985,723
Median Dwelling Price, Units: $745,168
Gross Rental Yield, Houses: 2.7%
Gross Rental Yield, Units: 3.4%
New South Wales Unemployment Rate (July’20): 7.2% (5.7% previously)
Property Cycle, Houses: Declining Market
Property Cycle, Units: Declining Market
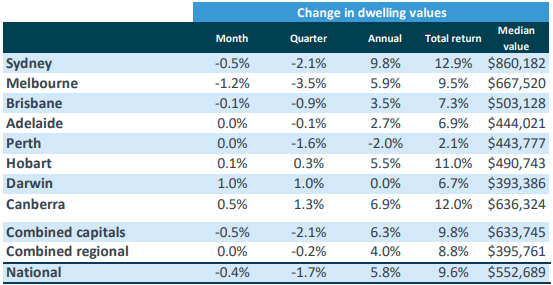
Sydney’s median dwelling (a combination of houses and units) values fell 0.5% in August 2020 to a median value of $860,182; however, it still sits comfortably at double digits with an annual dwelling value change of 12.9% and a total return of 12.9%. The upper quartile of values are also down 0.6%. Rental yields in Sydney remained at the record low of 2.9% with a drop in rent of 1.3% and 4.2% for houses and units respectively from March 31.
The Sydney property market has remained surprisingly resilient, despite the economic threats of COVID-19 and the first recession in over 30 years. In fact, the Sydney property market still remains around 8.5% higher than the August 2019 results. So far, the damage caused to the property market by the macroeconomic effects of COVID-19 have mostly impacted the rental market, as a combination of reduced international university students, and the overall state of the Australian economy (particularly unemployment) have ravaged the rental yields from investment properties.
Melbourne:
August: Capital Growth, Houses: - 1.4%
August: Capital Growth, Units: - 0.8%
August: Capital Growth, All Dwellings: - 1.2%
Median Dwelling Price, Houses: $781,888
Median Dwelling Price, Units: $562,780
Gross Rental Yield, Houses: 2.9%
Gross Rental Yield, Units: 3.9%
Victoria Unemployment Rate (July’20): 6.8% (previously 7.5%)
Property Cycle, Houses: Declining Market
Property Cycle, Units: Declining Market
The Melbourne property market is the only one of the eight major capital cities to record a decline of more than 1%, with a drop of 1.2% to a median value of $667,520. The annual change in dwelling values sit at 5.9% and a total return of 9.5%. Gross rental yields have remained higher than Sydney at 3.2% (compared to 2.9%), with drops in rent of 1.0% and 4.4% for houses and units respectively since March 31.
Unfortunately, with Melbourne being hit with stage 4 lockdowns during August, the property market has effectively been sidelined until at least the easing to stage 3 lockdowns as property inspections are considered forbidden. Despite this, there are still a few transactions that are happening throughout this period, but for most of the city, the property market remains in hold. What will follow is up for speculation, however, our neighbouring country of New Zealand also enforced a similar stage 4 lockdown, which resulted in about a month of limited activity, however, following the lifting of their lockdown, pent-up demand during the lockdown period produced record numbers in property transactions.
Brisbane
August: Capital Growth, Houses: 0.0%
August: Capital Growth, Units: - 0.3%
August: Capital Growth, All Dwellings: - 0.1%
Median Dwelling Price, Houses: $557,969
Median Dwelling Price, Units: $387,672
Gross Rental Yield, Houses: 4.2%
Gross Rental Yield, Units: 5.2%
Queensland Unemployment Rate (July’20): 8.8% (previously 7.7%)
Property Cycle, Houses: Rising Market
Property Cycle, Units: Rising Market
Brisbane’s median dwelling values dropped by only 0.1% in August 2020 to a median value of $503,128; however, it still sits positively with an annual change in dwelling value of 3.5% and a total return of 7.3%. Rental yields in Brisbane remain at a healthy 4.4%, with a negative change in rent of 0.1% and 1.3% for houses and units respectively since March 31. Queensland has also taken the crown of highest unemployment rate across the nation, with a rate of 8.8%.
Brisbane’s property market has remained relatively stable when compared to cities like Sydney and Melbourne, with only a moderate decline of 1% since COVID-19 hit. Also worth noting is the state of Queensland is also less dependent on foreign students. The Brisbane property market will likely be one of the better performing markets coming out of the pandemic as liveability, affordability and rapid gentrification remain as solid reasons.
Adelaide
August: Capital Growth, Houses: 0.0%
August: Capital Growth, Units: 0.3%
August: Capital Growth, All Dwellings: 0.0%
Median Dwelling Price, Houses: $480,972
Median Dwelling Price, Units: $331,334
Gross Rental Yield, Houses: 4.3%
Gross Rental Yield, Units: 5.4%
South Australia Unemployment Rate (July’20): 7.9% (previously 8.8%)
Property Cycle, Houses: Rising Market
Property Cycle, Units: Rising Market
Adelaide’s median dwelling values remained steady at 0% with a median value of $444,021, but still sits at a positive annual change of 2.7% and a total return of 6.9%. The unemployment rate in South Australia has dropped to 7.9% from the previous nation-wide high of 8.8%. Gross rental yields sit at a stable 4.5% with a 0.7% increase in rents for houses and a 0.2% decrease for units since March 31.
Adelaide remains as one of the more stable capital cities, with only a 0.1% drop this quarter.
Perth
August: Capital Growth, Houses: 0.0%
August: Capital Growth, Units: - 0.1%
August: Capital Growth, All Dwellings: 0.0%
Median Dwelling Price, Houses: $461,891
Median Dwelling Price, Units: $350,394
Gross Rental Yield, Houses: 4.3%
Gross Rental Yield, Units: 5.3%
Western Australia Unemployment Rate (July’20): 8.3% (previously 8.7%)
Property Cycle, Houses: Bottom of the market
Property Cycle, Units: Bottom of the market
Perth’s median dwelling values also remained steady at 0% with a median value of $443,777. Perth also sits at a - 2.0% annual change in dwelling values, with a 2.1% total return, however, it is worth noting that during the March 2020 update, Perth sat at an annual change of negative 3.1%. Western Australia’s unemployment rate still sits solidly at second place with a rate of 8.3% (albeit a drop from 8.7% in the previous month). On the rental front, gross yields sit at 4.4% with increases in rents for both houses and units at 2.1% and 0.9% respectively since March 31.
Prior to the effects of COVID-19, Perth was actually beginning their recovery in dwelling values from their sharp decline a few years prior. However, the overall impacts of the virus and Australia’s overall economic landscape have temporarily stunted that growth.
Hobart
August: Capital Growth, Houses: 0.3%
August: Capital Growth, Units: - 0.7%
August: Capital Growth, All Dwellings: 0.1%
Median Dwelling Price, Houses: $517,877
Median Dwelling Price, Units: $400,578
Gross Rental Yield, Houses: 4.7%
Gross Rental Yield, Units: 4.8%
Tasmania Unemployment Rate (July ’20): 6.0% (previously 6.9%)
Property Cycle, Houses: Rising Market
Property Cycle, Units: Rising Market
Hobart’s median dwelling values increased by 0.1% to a median value of $490,743. Annual changes remain at a positive 5.5% with a healthy total return of 11%. Rental yields for Hobart sit at 4.7%, with negative drops in rent of 3.1% and 5.1% for houses and units respectively since March 31.
With much of Hobart’s economy depending on the tourism sector, it is likely that the longer COVID-19 affects the nation’s overall economy, the greater the losses that Hobart would face. The decimation of the Airbnb rental space with fewer Airbnb bookings in this COVID world have caused the changes in rent to plummet.
Darwin
August: Capital Growth, Houses: 1.1%
August: Capital Growth, Units: 0.7%
August: Capital Growth, All Dwellings: 1.0%
Median Dwelling Price, Houses: $476,143
Median Dwelling Price, Units: $277,551
Gross Rental Yield, Houses: 5.4%
Gross Rental Yield, Units: 6.8%
Northern Territory Unemployment Rate (July’20): 7.5% (previously 5.7%)
Property Cycle, Houses: Bottom of the market
Property Cycle, Units: Bottom of the market
Darwin’s median dwelling values have recorded an increase of 1.0% to a median value of $393,386, which is the largest increase across the capital cities (with the next highest increase being Canberra at 0.5%). Due to the August dwelling value increase, Darwin now sits at an annual dwelling change of 0%, with a total return of 6.7%. Gross rental yields sit at a nation high of 5.9%, with increases in rent for houses and units of 1.1% and 0.5% respectively since March 31.
Over the August 2020 period, Darwin experienced nation topping numbers in both changes in dwelling values and gross rental yield (at 1.0% and 5.9% respectively). However, Darwin’s dwellings still remain as the lowest across capital cities at $393,386, with the next lowest capital city being Perth at $443,777.
Canberra
August: Capital Growth, Houses: 0.5%
August: Capital Growth, Units: 0.5%
August: Capital Growth, All Dwellings: 0.5%
Median Dwelling Price, Houses: $716,400
Median Dwelling Price, Units: $450,757
Gross Rental Yield, Houses: 4.4%
Gross Rental Yield, Units: 5.7%
Australian Capital Territory Unemployment Rate (July’20): 4.6%
Property Cycle, Houses: Rising Market
Property Cycle, Units: Declining Market
Canberra recorded a modest 0.5% increase in median value in August 2020 to a median value of $636,324. The annual change in dwelling values also sits at a comfortable 6.9%, with a healthy double digit total return of 12.0%. Gross rental yields for Canberra sits at a healthy 4.4% for houses and 5.7% for units, with a decrease in rents for both houses and units of 0.6% and 1.5% for houses and units respectively since March 31.
The past month marks the third consecutive monthly increase in dwelling values for Canberra (previously +0.6%). Canberra is less likely to feel the economic impacts of COVID-19, as a good majority of the population is employed under the public sector, thereby having a greater stability during tough economic times.
As we approach another month of a COVID-19 impacted market, the overall property market has remained incredibly resilient, with much of previous declines easing into steady or positive gains (such as Perth, Hobart and Darwin). Stage 4 lockdowns and stalled domestic and international migration into Melbourne have temporarily paralyzed the property market within Victoria. There is, therefore, a logical correlation between the extent of social distancing policies and lockdowns that are currently being enforced to the overall consumer sentiment within the Melbourne market, which resulted in the nation-high decline of 1.2%. However, despite this decline, Melbourne could follow a similar trajectory as New Zealand post-lockdown, with increased demand building during this current lockdown period causing potentially record number transactions post-lockdown.
There are three influential factors that are currently impacting the Australian property market and the Australian economy as a whole, these include:
The impact of COVID-19 on the overall employment rates across the nation, and the economic life-support packages such as job-keeper and job-seeker as well as loan repayment holidays from lenders
A recession, not seen in Australia for almost 30 years
Global political and social unrest
We can once again see that the Australian property market is not something that can be summarised as a whole; our age old saying that there are many markets within markets ring true. Diversity between markets is the main sticking point in this market update, with varying degrees of declines and increases within cities that have either been more or less impacted by the economic and social effects of COVID-19. With treasurer Josh Frydenberg recently confirming the first Australian recession in over 30 years, sentiment could see a further drop, however, we have not yet seen a crash or decline despite its (apparent) unavoidable forthcoming that seems to plague the headlines of mainstream media.
Only time will tell how the property market will react, however, a few upcoming factors such as the reduction in fiscal policies and the release of the federal budget in October should provide more clarity then.
Index results as at August 31, 2020
Source: Corelogic Hedonic Home Value Index

CoreLogic Home Value Index Tables
Source: CoreLogic Hedonic Home Value Index

Changes in rents, March 31 - August 31
Source: CoreLogic Hedonic Home Value Index

Gross Rental Yields, August 2020
Source: CoreLogic Hedonic Home Value Index
Sources: CoreLogic Hedonic Home Value Index | Michael Yardney’s Property Update |
Get in touch to find out how we can help you with your property journey.
If you like this post, we’d love it if you could share :)
Disclaimer: All data and information provided on this site are for informational purposes only. Milk Chocolate makes no representations as to accuracy, completeness, currentness, suitability, or validity of any information on this site and will not be liable for any errors, omissions, or delays in this information or any losses, injuries, or damages arising from its display or use. All information is provided on an as-is basis.
