

Q1 2021 has ended with new record highs across all capital cities. According to Corelogic, the national home value index increased a further 2.8%, placing values 5.6% above the previous market peak in October 2017. The combined value of Australian dwellings hit $7.9 trillion dollars over the month, which is 3 x the total capitalisation of the stock market. This cements residential property as an important asset class.
Prices
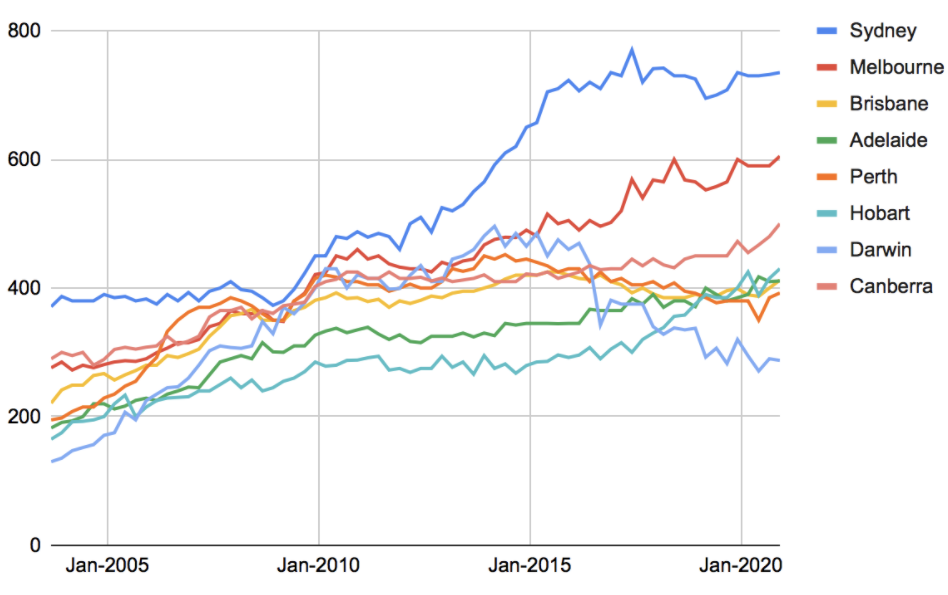
At the current price levels, there are three distinct sub-markets in Australia:
Sydney (top-tier): Sydney took off significantly and distinctly in comparison with other capital cities since 2009, just after the Global Financial Crisis in 2008. Being a volatile market, the current prices in Sydney are just equal to the same level in 2017. Therefore, we anticipate that Sydney will continue to keep the momentum for the remaining months of 2021 thanks to ultra-low interest rates, low stock, the much-anticipated re-opening of the border.
Canberra and Melbourne (the mid-tier): Canberra has been catching up with Melbourne in recent years, and it overtook Melbourne to take the title of the second most expensive property market in Australia. Being a small regional city, Canberra is the capital city where large government departments are located that offer high-paying jobs, coupled with limited land supply and a desirable lifestyle. Canberra is expected to remain a prominent destination to invest in the next few years. Melbourne has a similar size to Sydney in terms of economy and population, yet it offers more affordable housing and more choices than in Sydney. Currently, property in Melbourne is 25% to 30% cheaper than in Sydney.
Brisbane, Perth, Adelaide, Hobart, Darwin (the affordable and safe markets): these cities offer lifestyle, affordable price and consistent capital growth over the long term. There is a growing demand for properties from interstate buyers, especially from Sydney in these markets.
Chart 1: Median prices of detached properties, capital cities

Chart 2: Median prices of attached properties, capital cities
Volume of transactions
Due to covid lockdown and restrictions, the volume of transactions went down substantially in early 2020. However, the market has picked up substantially in recent months, on track to regain the momentum to pre-covid levels. Currently, the number of properties that were sold per quarter is approximately 15,000 in Sydney and 13,000 in Melbourne. The increasing volume of transactions has also been observed in other capital cities, especially in Brisbane and Perth.
Chart 3: Number of transactions, detached properties

Chart 4: Number of transactions, attached properties

The relative median prices between capital cities
Our data shows that the property prices in capital cities are generally correlated with each other over the long term. The rough idea is that, when Sydney becomes too expensive or the gap between Sydney and other capital cities becomes wider, buyers will turn to other cities that will push up the prices in the alternative markets. The gap will likely become narrower and eventually return to the long-run gap.
The relative prices between other capital cities and Sydney have been stabilising over the last few years. Roughly, the prices in Melbourne and Canberra are approximately 75% of Sydney’s prices; and the rest of the capital cities are approximately 50% of Sydney’s prices.
The recent rise of Sydney and Melbourne in the last few months, demonstrated by substantially high clearance rates, will likely trigger the rise in other capital cities, especially in Perth, Brisbane, and Adelaide.
Our analysis predicts that, while Sydney and Melbourne will lead the national market in the next couple of years, other capital city markets will take off in parallel with Sydney and Melbourne.
Chart 5: Relative median prices between capital cities

Chart 6: Price of Sydney-Price of the other capital cities, percentage

Building approvals
The number of building approvals is one of the leading indicators of the property market. According to the latest data release from ABS, due to the effects of covid, the number of approvals has been substantially below the long-term average, down by 27% in Sydney and 46% in Melbourne.
This will likely translate to the shortage of properties in the next 1-2 years, at the time the border would be open again to immigration, tourists, and students. Many experts have predicted that the prices could gain 20-30% in the next 2 years.
Chart 9: Building approvals per month, Sydney and Melbourne

Financial commitments
For the first time in many years, the total new loan commitments to owner occupiers has surpassed 10,000 in February, 2021. The main contributors were the ultra low interest rate, price decline during the pandemic and numerous grants by the government to support first home buyers.
In the normal market, investors account for 35% of total new loan commitments. However, the share of investors has declined to the lowest level since 2,000. Less investors mean less competition, which will open a short window of opportunities for astute investors, before the level of investors will return to the long-term trends.
Chart 10: New loan commitments to owner occupier first home buyers (seasonally adjusted), number, by state

Chart 11: New loan commitments, total housing (seasonally adjusted), values, Australia

Chart 12: New loan commitments, total housing (seasonally adjusted), share, Australia

The cash rate
The RBA has cut the cash rate to the lowest level in history. In the context of the one in a century pandemic, the RBA has flagged that the low rate will stay for a foreseeable future in an effort to revive the economy in the next few years.
However, the RBA and the APRA will closely monitor the developments of the housing market to ensure the level of lending is within the safety levels of the financial system. Therefore, despite low interest rates, home buyers and investors are advised to add a buffer in the event of policy changes. This will come to the prudent asset selection process: identifying properties in the areas that can achieve high yield and consistent capital growth.
Chart 13: Cash Rates

Conclusion
The property market has shown unanticipated developments in the last quarter, which are due to new market conditions: low-interest rates, changing attitudes about the types of property to buy, and in the context of low population growth.
Overall, the leading indicators and our analysis project the property market will likely continue the current momentum in 2021 and beyond, fuelled by foreseeable low-interest rate, the gradual return of immigrants, tourists, and international students, as well as low level of building approvals during 2020.
If you like this post, we’d love it if you could share :)
Disclaimer: All data and information provided on this site are for informational purposes only. Milk Chocolate makes no representations as to accuracy, completeness, recency, suitability, or validity of any information on this site and will not be liable for any errors, omissions, or delays in this information or any losses, injuries, or damages arising from its display or use. All information is provided on an as-is basis.
